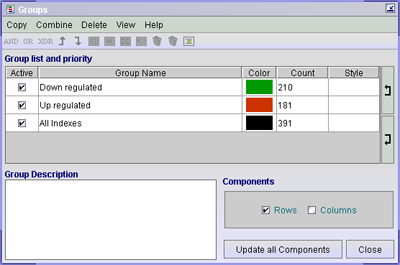

The Groups Window.
The Groups window contains a list of all created groups. In addition the number of profiles contained in each group is shown in the column labelled "Count". The list is hierarchical, so if a profile is a member of several groups, the topmost group membership is the one that is applied to the profile when displayed. For instance, if a profile is a member of both groups 1 and 3 in the image above, then J-Express Pro will display the group as a member of group 3 since this group is higher in the list.
Change the name of a group by double-clicking
the Group Name entry and entering a new one. To move a group up or down
in the list use the ![]() and
and
![]() buttons
to the right of the list.
buttons
to the right of the list.
If you want to temporarily disable the highlighting of a group, uncheck the Active box to the left of the groupís name in the list. To re-enable the highlight for the group, check the Active box again.
To change the color of a groupís highlight, click the Color box of the group. A color selector dialog opens that lets you choose a new color .
To copy the groups to children nodes
in the Project Tree select the Copy Group to Children ( ![]() )
button.
)
button.
To copy the groups to the parent node
in the Project Tree click the Copy Group to Parent ( ![]() )
button.
)
button.
To perform a logical AND operation on groups, select the groups, and then click the AND button. This will create a new group containing only the profiles that are members of all the selected groups.
To perform a logical OR operation on groups, select the groups, and then click the OR button. This will create a new group containing the members of all the selected groups.
To display the contents of a selected group in a spreadsheet, click the Show
group in table button ( ![]() ). This will open a spreadsheet window containing the data of all the profiles
in the selected group.
). This will open a spreadsheet window containing the data of all the profiles
in the selected group.
To display the contents of a selected group in a Gene Graph window, click the
Show group in graph button ( ![]() ). This will open a gene graph window containing all the profiles of the selected
group.
). This will open a gene graph window containing all the profiles of the selected
group.
To display thumbnails of all defined groups, click the Show all groups as
thumbs button ( ![]() ). This will bring a window similar in function to the K-means window showing
thumbnails of all defined groups. See section 3.4.2 for additional informati
on.
). This will bring a window similar in function to the K-means window showing
thumbnails of all defined groups. See section 3.4.2 for additional informati
on.
To branch the data contained in a selected group into a sub-node of the project
tree, click the Branch data button ( ![]() ).
).
To remove groups from the list select the group you want to remove by clicking
on its entry in the list, and then clicking the Delete Group button (
![]() ).
).
To remove groups and the profiles associated
with the group from the data set completely, select the group from the list,
and click the ![]() (Delete Group From Data) button.
(Delete Group From Data) button.
The information contained in the group controller can be
written to a Group Legend by clicking the ![]() button, and then saved.
button, and then saved.
All these functions are also available from the Group Controller menu bar.
Note: Changing group color and hierarchy does not take effect until you click the Update All Components button.
Click the Close button to remove the Groups window.
Note on selections:
If you have several windows open, profiles you have selected in one window will remain selected in the others. For instance, if you can select a profile of interest in a Hierarchical Clustering Window, the profile will be automatically selected when you open a Find Similar Profiles window. If changes you make do not take effect immediately, press the