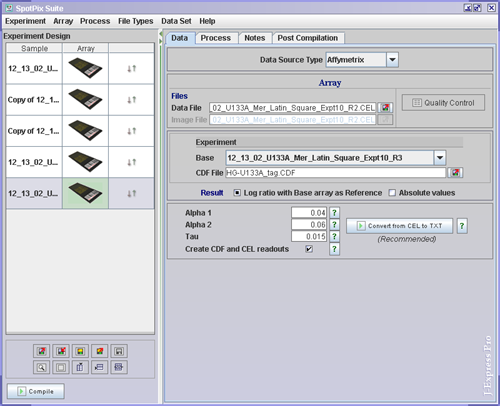

To link the affymetrix files to the array images ( ![]() ),
click on each array and set the affymetrix data and image files by clicking
the Load Experiment(
),
click on each array and set the affymetrix data and image files by clicking
the Load Experiment( ![]() ) buttons in the Data Tab. Set the CDF File. If
you need to do normalizations or present your results as log ratios, select
one of your arrays to use as Base.
) buttons in the Data Tab. Set the CDF File. If
you need to do normalizations or present your results as log ratios, select
one of your arrays to use as Base.
Decide whether you want your result presented as Log ratio or Absolute values
It is now a good idea to save the experiment. Save by clicking
the Save Experiment( ![]() ) button, to the left of the divider, underneath the experimental design.
) button, to the left of the divider, underneath the experimental design.
The ![]() Quality Control button opens a window that allows you to examine the quality
of your chip. All statistics used on probe pairs and probe sets are taken from
http://www.affymetrix.com/support/technical/whitepapers/sadd_whitepaper.pdf
Quality Control button opens a window that allows you to examine the quality
of your chip. All statistics used on probe pairs and probe sets are taken from
http://www.affymetrix.com/support/technical/whitepapers/sadd_whitepaper.pdf

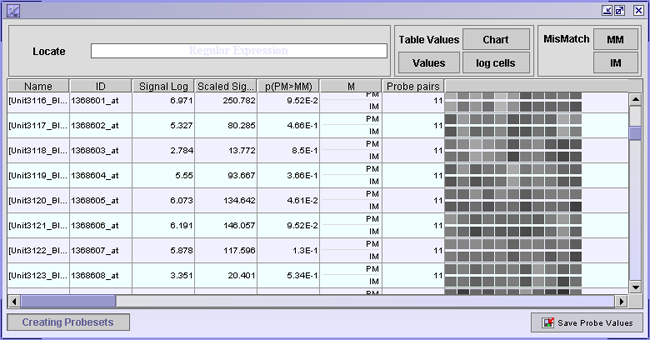
The table shown in this window displays information on each probe pair in your dataset. A probe pair consists of two probes, one that matches perfectly to the target mRNA (PM) and a probe where one mismatch (MM) has been introduced.
Each row has information on a probe set. A probe set is a collection of probe pairs, all with the same mRNA as a target, located at different places around the array. Ideally all PM probes within one probe set and all MM probes should have the same intensity, or at least similar ratios of each probe pair. This is often not the case.
The table values can be presented in three different ways:
The probe that has a mismatch introduced into it, should have lower intensity than its PM variant. If the MM probe has higher intensity than the PM probe, an ideal mismatch (IM) is calculated. To view the calculated ideal mismatches click the IM button. Click forth and back between MM and IM buttons to see where an ideal mismatch has been calculated.
If you are looking for particular probes, you can search for them using a regular expression in the search field provided.