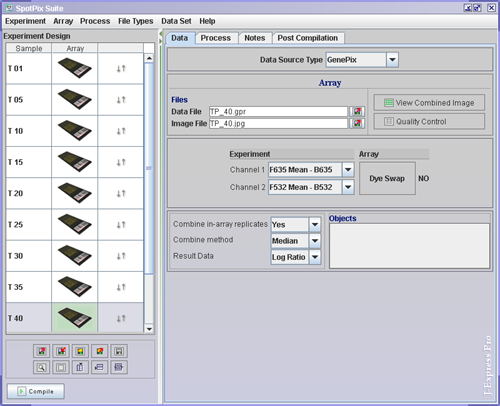

To link the genepix files to the array images ( ![]() ),
click on each array and set the genepix data and image files by clicking the
Load Experiment(
),
click on each array and set the genepix data and image files by clicking the
Load Experiment( ![]() ) buttons in the Data Tab. It is now a good idea to save the experiment.
Save by clicking the Save Experiment(
) buttons in the Data Tab. It is now a good idea to save the experiment.
Save by clicking the Save Experiment( ![]() ) button, to the left of the divider, underneath the experimental design.
) button, to the left of the divider, underneath the experimental design.
Experiment | Search for image files in folder
Search for image files in folder is only available for GenePix. The .gpr files are searched for the name of the image files. Next the images in the selected folder are mapped to the .gpr file. This is valuable if a project file is sent to someone else who already have the image files. This basically sets the correct file path.
Experiment/Array (Data Tab)
Set the preferred selection for Channel 1 and Channel 2. For instance, if Channel 1 is set to F635 Mean - B635, this means that the color of this channel is red (wavelength 635 nm) and that mean pixel intensity is used for the foreground. (Green light has wavelength of 532 nm.)
F - foreground
B - background
635 - wavelength of red light
532 - wavelength of green light
If dye swap has been carried out on an experiment/array, J-Express Pro needs to know this. If that is the case, click the Dye Swap button on the dye swap array.
Experiment
Select the preferred values for the combo boxes at Combine in-array replicates, combine method, and Result Data. Combine in-array replicates means that replicates on the same array will be combined in some way, so that they are all represented by just one value. If the Combine in-array replicates is set to yes, remember to also set which method to used to combine the replicates.
Certain Objects can be saved to a project. An Icon will appear in the Object field. To view or continue working with an object, double-click the icons. There are two different types of object that can be saved to a project:
Spot View ![]() and Selection Container
and Selection Container ![]()
These are described further down on this page.
The ![]() Quality Control button opens a window that allows you to examine the quality
of your chip. This may help you decide what how to normalize your data.
Quality Control button opens a window that allows you to examine the quality
of your chip. This may help you decide what how to normalize your data.
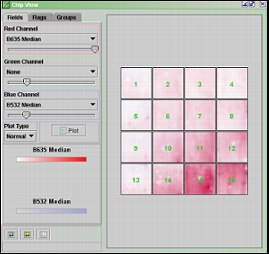
The Chip View window displays an array to the right, and three tabs to the left. The three tabs are Fields, Flags and Groups.
Fields
The fields tab contains a red, a green and a blue channel. The three channels represent the primary RGB colors. Each of these has a selection of settings that can be chosen from the combo boxes. The various settings allow you to examine how the background intensities are in comparison to the foreground intensities for different areas of the chip. Play around with different selections in the combo boxes. Slide the color bars to tune the color intensities. Press the Plot button to update the chip view. Looking at the picture above, which plots the background distribution in red and blue channel, it is apparent that the background intensities are not the same all over the chip. It is also possible to view the real chip image by right-clicking any of the blocks in the array and select View Chip Image.
The Chip View can be saved as an image by clicking the Save
Array View Image( ![]() ) button. To save the scale bars for the different channels, click
the Save Array View Scale(
) button. To save the scale bars for the different channels, click
the Save Array View Scale( ![]() ) button.
) button.
Flags
The flags tab allows you to see if there are many spots not found by genepix. Click Add. Next click the 0 in the new added line, and choose -50. You can change color by clicking on the black rectangle. Click plot. The chip view will now show the Spots not found by GenePix. -100 means spot missing.
The Chip View can be saved as an image by clicking the Save
Array View Image( ![]() ) button. To save the Flag and flag color as an image,
click the Save Array View Scale(
) button. To save the Flag and flag color as an image,
click the Save Array View Scale( ![]() ) button.
) button.
Groups
You can divide the blocks in the array into different groups. Select the blocks you want in a separate group by clicking and dragging the mouse over them (the entire block has to be inside the square that is drawn when clicking and dragging, in order to be selected). Right-click on one of the selected blocks, and select Create new Group. The selected blocks will now be removed from the original group and added to the new group. If you want to add some blocks to a group that already exists, select the group you want it added to in the group list, click and drag mouse to select the new block(s), right-click and select Add Selection To Selected Group.
The selected blocks can be given their own color by Right-clicking on one of the selected blocks, and selecting Set Block Color.
It is also possible to plot the various fields available against
each other for a group. Right-click and select Plot Block, or press the
Plot Selected Blocks( ![]() ) button at the bottom left hand corner or the Chip View window. This will
open an array scatter plot window.
) button at the bottom left hand corner or the Chip View window. This will
open an array scatter plot window.
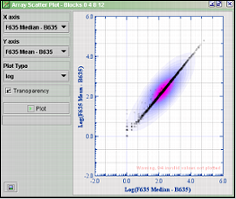
The plot above plots the median/mean ratio for blocks 0, 4, 8 and12
Select the fields you want to plot at the X-axis and
Y-axis pull-down menus. Choose a Plot Type and click Plot.
The plot can be saved by clicking the Save Array Plot Image ( ![]() ).
).
The ![]() View Combined Image button opens the Chip Image View window.
View Combined Image button opens the Chip Image View window.
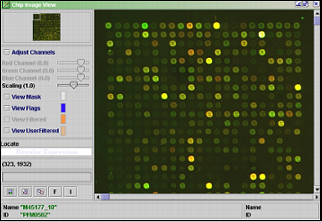
The picture to the right depicts the microarray combined of the scanned pictures from the red and green channels.
Adjust Channels - check to adjust the RGB color contrasts.
Scaling - slide to zoom in or out of the picture
The color of the next four check buttons can be changed by clicking on the colored rectangle.
View Mask - check to draw a circle around the spot. This tells J-Express where the spots are, and can also make it easier to see the spots.
View Flags - check to draw a circle around the flagged spots
View Filtered - check to draw a circle around the filtered spots. See that no "good" spots are filtered.
View User Filtered - By clicking the F button you can manually filter spots. You can also manually filter spots in the replicate view window. When selecting this checkbox, you can color the frame of manually filtered spots.
Locate - Type the name or id of a spot to have it highlighted.
Open Linked File Value Table( ![]() ):
):
Click Open Linked File Value Table( ![]() ) button to open a spreadsheet containing all the raw data values associated
with each spot on the array.
) button to open a spreadsheet containing all the raw data values associated
with each spot on the array.
Link Events To Open Value Table( ![]() ):
):
Linking events to open value tables means that file value tables that are open, will be linked to the spots in the picture. When clicking on the spots, the corresponding entry in all the file value tables will be highlighted. This way you can see what values the spot you click has in the data file. Note: The "View mask" checkbox has to be selected for this to work.
F:
If you want to filter the spots manually, you can do so by click the button labeled F before clicking spots you wish flag.
I:
To examine some spots further, make sure that "View Mask" is checked and click the button labeled I. This will open an empty Selection container. Click on spots you want to add to the Selection container. If more than one selection container is open simultaneously, the spots that are clicked will be added to all of the selection containers that are open.
The Selection Container
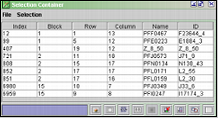
The selection container contains location data and id of the spots
you clicked. Selecting entries in the Selection Container will mark the corresponding
spots with a light blue square in the Chip Image View window. If a File
Value Table ( ![]() ) is open, the selection should be marked there as well. From the File
Value Table you can see the values of the entries in the Selection Container.
) is open, the selection should be marked there as well. From the File
Value Table you can see the values of the entries in the Selection Container.
To clear a selection container press the Clear Selection
Table ( ![]() )
button. To delete rows from the selection container, select the rows you want
to delete and press the Remove Selected Elements (
)
button. To delete rows from the selection container, select the rows you want
to delete and press the Remove Selected Elements ( ![]() )
button.
)
button.
Find in-Array Replicates ( ![]() ):
):
To locate in-array replicates to the entries in your selection
container, press the Find in-Array Replicates ( ![]() ) button. This will look up all the selected entries in the selection
container and add the replicates to the selection container if they exist.
) button. This will look up all the selected entries in the selection
container and add the replicates to the selection container if they exist.
Storing the selection container in a project:
The selection container can be saved to a project. To do so press
the Store in Experiment ( ![]() ) button. The icon
) button. The icon ![]() will appear in the Object field of the data tab.
To start a new selection container, press the New Table
button.
will appear in the Object field of the data tab.
To start a new selection container, press the New Table
button.
Click Get Spot Images ( ![]() ) button to view the selected spots on all the different arrays.
) button to view the selected spots on all the different arrays.
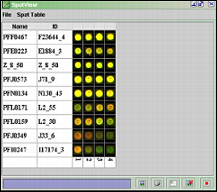
The SpotView can be saved ( ![]() ), printed (
), printed ( ![]() ), exported to HTML (
), exported to HTML ( ![]() ) and stored in an experiment (
) and stored in an experiment ( ![]() ). If the spotview is stored in an experiment, the icon
). If the spotview is stored in an experiment, the icon ![]() will appear in the Object field of the data tab.
The image can also be copied to clipboard by pressing the Copy Image
to Clipboard (
will appear in the Object field of the data tab.
The image can also be copied to clipboard by pressing the Copy Image
to Clipboard ( ![]() )
button.
)
button.