Batch effects are technical sources of variation that have been added to the samples during handling. For example if you have too many samples to label them all at the same time you will have to split the job into managable rounds of labelling. The samples labelled at the same time will get the same amount of technical variance added to them, but samples labelled at different times may have different amounts of variance added to them. We refer to this as labelling batch. It is important that this type of technical variation does not confound with the biology, meaning that biological treatment groups overlap with technical groups. Technical batch effects confounding with the biology can be avoided by careful planning of every step of the experiment. This is an important part of the experimental design. In the following section we will assume that we are dealing with experiments that have good experimental designs, and describe how you can look for batch effects in the dataset.
As for outlier detection, batch effects are often evaluated using explorative approaches, involving distance measures, clustering and spatial methods. In addition contrasting colours are very useful. If the labelling was done over e.g. 3 days, we can colour the samples labelled on one day 1 red, the samples labelled on day 2 blue and the samples labelled on day 3 green, which makes it much easier to visually discover batch effects from plots, see examples below.
Shortlisted guideline:
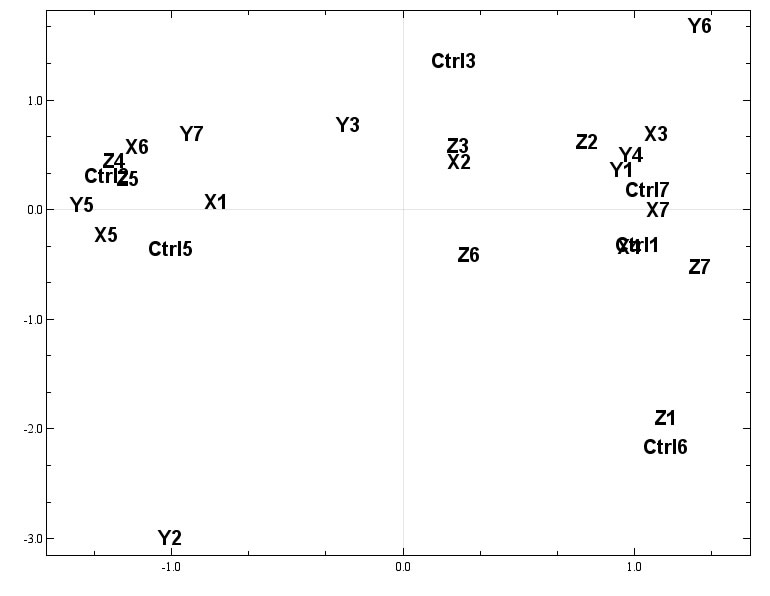
For this example we will use a PCA plots.

Without any colours it is difficult to see any patterns in this plot.

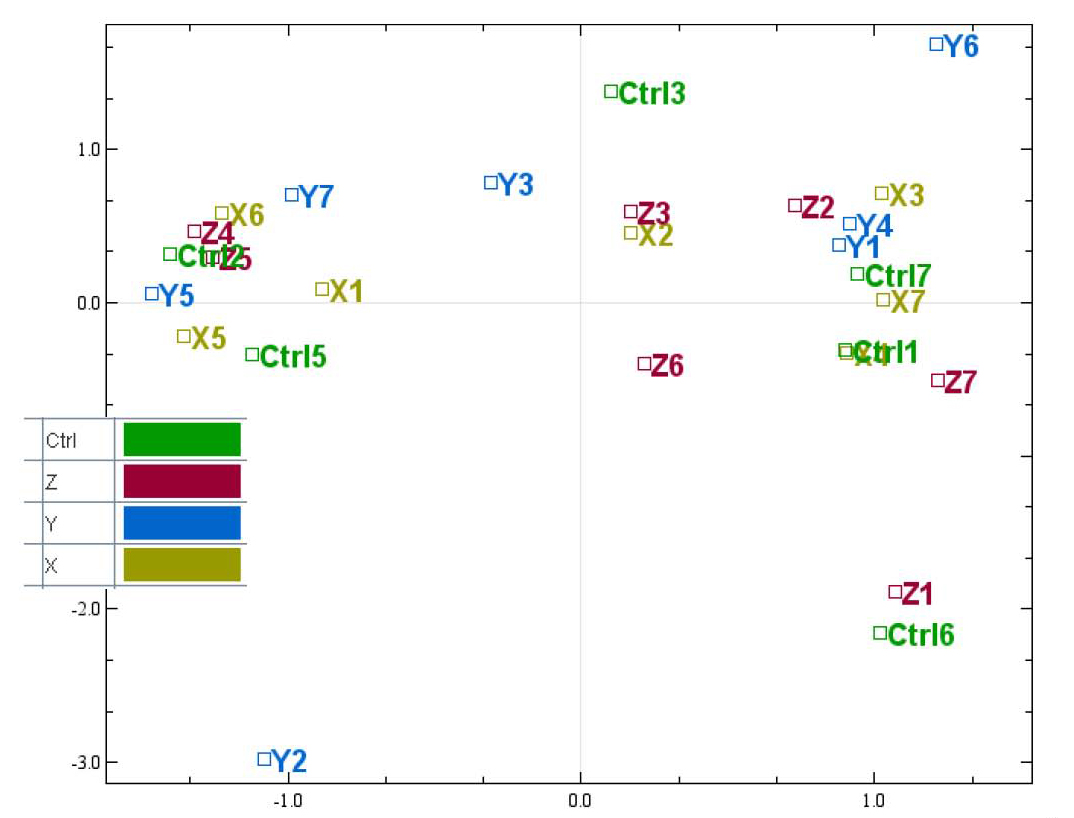
There are 4 biological groups in this dataset, and each have been given a different colour. We now see that all the biological groups are mixed well, which means that it could be difficult find differentially expressed between the biological groups. It also looks like the there are 3 clusters in the plot, that are not caused by the biological groups we want to test. To see if this is caused by any technical handling, we can easily test for different types of batch effects by giving the samples new colours.

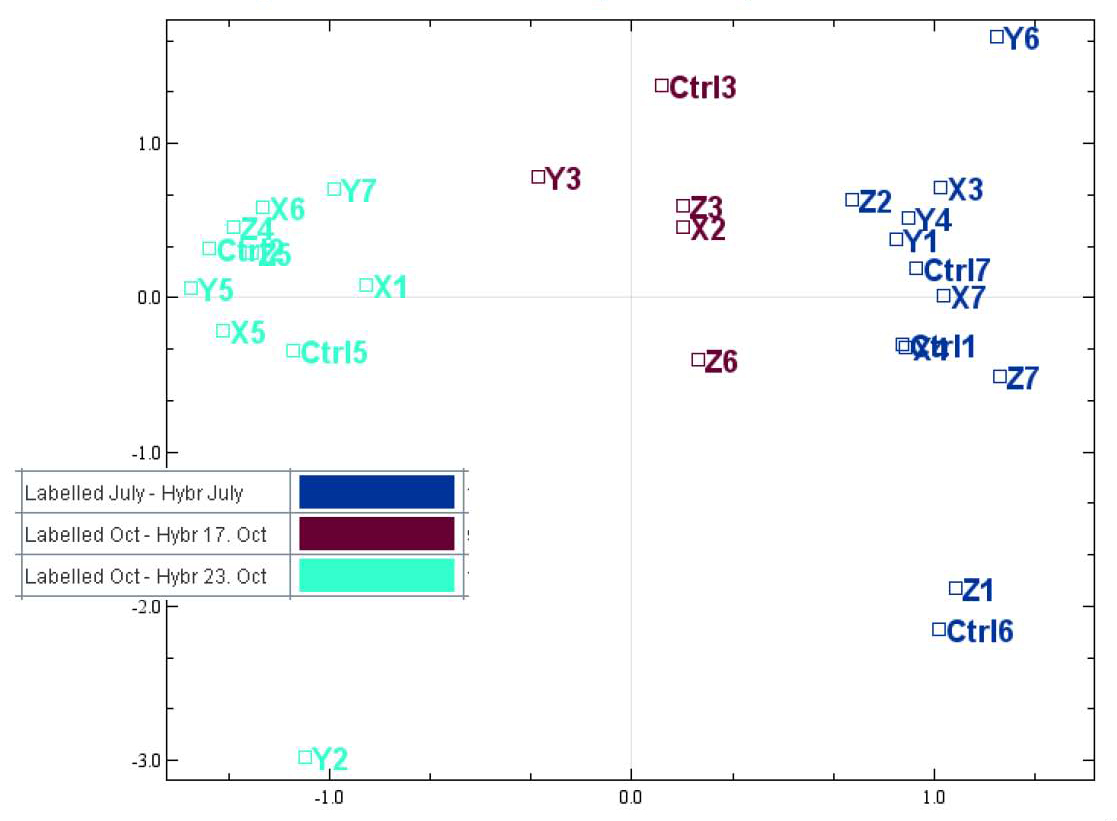
In this plot we have coloured the samples according to labelling batch. It is now easy to see that the 3 clusters in the plot can be explained by labelling batch. The good thing is that all of the biological groups we are interested in are present in each of the labelling batches.