Outlier samples can occur in datasets for a number of reasons. The reasons are usually categorised as either technical or biological. If the biological material are cell cultures, it is likely that the reason is technical. If the biological material are human biopsies, the reason can be either technical (something went wrong with one of the samples during preparation) or biological (e.g. medical condition). If a biopsi is taken from the same part of the tissue for all but one individual, then one sample could be an outlier due to cell type composition. This could be termed a technical outlier because the sample was taken from the wrong place, or it can be termed biological outlier because the cell type composition is different. Most likely all samples from biopsies will have slightly different cell type composition, meaning that all samples could be termed biological outliers. Since this doesn't really help us proceed, it is often termed a dataset with a lot of individual variance. In these cases we would keep all the samples, knowing that we will probably only be able to identify large changes in the dataset.
The underlying assumption when analysing microarray data is that the distribution of signals is the same for all of the arrays, or at least that the samples are reasonably similar. A sample that behaves differently from the other samples is termed an outlier sample. Outlier samples may cause problems during data analysis and should be considered left out in further downstream analysis. Outlier detection is often based on distance measures, clustering and spatial methods. As you can see from the examples below, sometimes it is clear when a sample is an outlier, while other times it is more difficult to decide. Usually it is a good idea to evaluate the data by different methods and plots. Here we will show some examples and try to give some guidelines for when a sample should be considered excluded from the dataset. Important: If you remove a sample from the dataset, you have to say that you removed it and then give your reason for doing so!
Shortlisted guideline:
Two-colour microarray

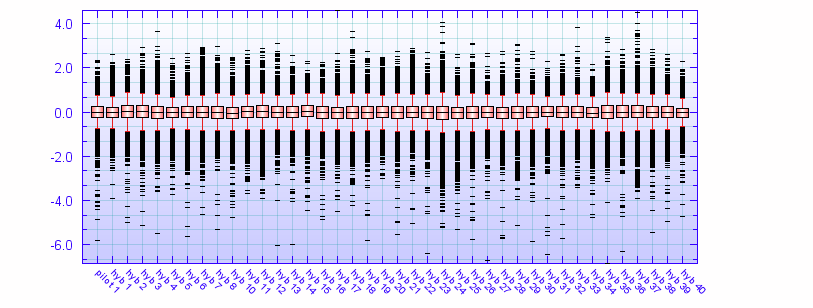
A boxplot is used to compare the distribution of log2 ratios for the different samples. The different samples look like they have similar distributions, although some samples, e.g. sample "hyb 24" has thicker tails than the other samples.

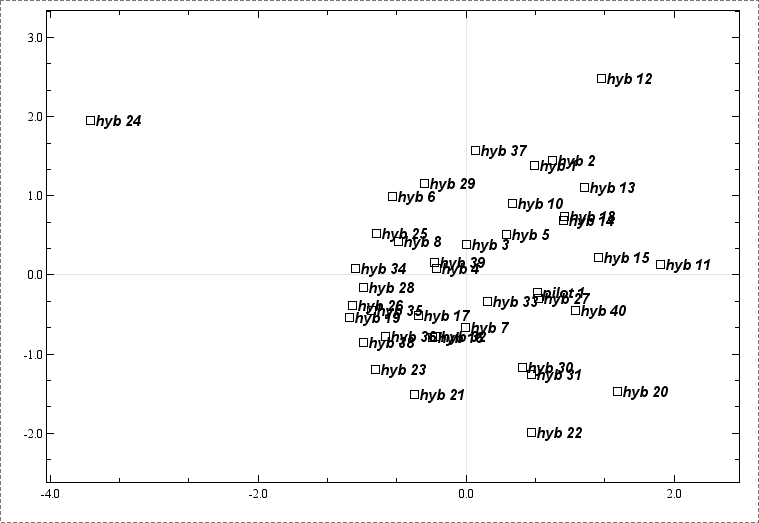
Next we do a correspondance analysis plot and see that there are two samples that may be regarded as outliers. The sample named "hyb 24" looks like a clear outlier, while "hyb 12" is less clear.

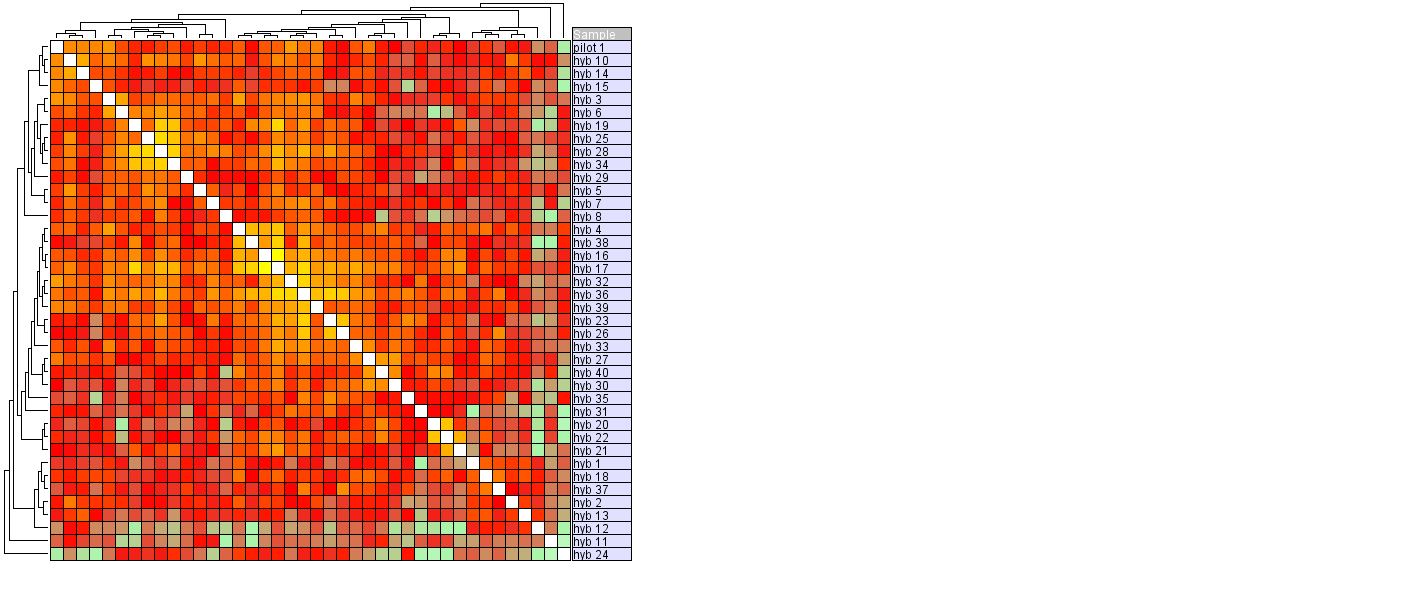
Hierarchic clustering (using Pearson Correlation as distance measure) we see that "hyb 11" and "hyb 24" do not cluster with the other samples, but instead create two singltons on their own.
Conclusion: Sample "hyb 24" shows up as a outlier in all of the plots and is therefore regarded as being an outlier.