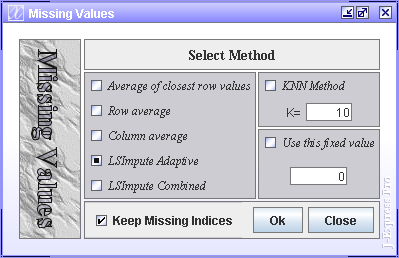

The missing values dialog helps replace erroneous data.
Average of closest values. Calculates the average value of the data entries to either side (if available) of the missing value, and then uses this average in place of the missing value.
Row average. Calculates the average of all the data values of the row the missing values is a member of, and then uses this average in place of the missing value.
Column average. Calculates the average of all the data values of the column the missing value is a member of, and then uses this average in place of the missing value.
LSimpute Adaptive and LSimputeCombined - The Least Square impute methods exploit correlated genes to draw a best fit straight line y=ax+b through points representing the expression level of each sample. The idea is then that if the expression of gene x is known, the regression model can be used to estimate the expression level of gene y. Please refer to the following paper for method description:
LSimpute: accurate estimation of missing values in microarray
data with least squares methods
Department of Informatics and 2 Computational Biology Unit, BCCS,
University of Bergen, HIB, N5020 Bergen, Norway.
Nucleic Acids Research, 2004, Vol. 32, No. 3 e34
KNN Method - It calculates the K most similar profiles based on Euclidian distance of the row containing the missing value, and then computes the missing value as the weighted average value of these profiles for the column containing the missing value. Please refer to the following paper for method description:
Missing value estimation methods for
DNA Microarrays.
Olga Troyanskaya1, Michael Cantor1, Orly Alter2, Gavin Sherlock2,
Pat Brown3,6, David Botstein2, Robert Tibshirani4, Trevor Hastie5, Russ
Altman1
1Stanford Medical Informatics, Stanford University School of Medicine Departments
of 2Genetics, 3Biochemistry, 4Health Research & Policy and Statistics,
5Statistics and Health Research & Policy, and 6Howard Hughes Medical
Institute, Stanford University
Bioinformatics. 2001 17:520-525.
Fixed Value - sets all missing values to the value specified here.
It is recommended to check the Keep Missing Indices to save these indices for later. These indices can be used to overlook the missing values when calculating distances (weighted euclidean) and in various forms of visualization (Hierarchical clustering). For line charts, the line from or to a missing value will be absent.