With one channel plots you can plot the different arrays agaist each other.
1. Click the ![]() button
button
2. Click the Other button.
3. Click the 1Channel Plot button.
4. In the plot type, select log
5. CH 1 is set to This Array, i.e. the array you have selected in the Sample area. Set CH 2 to any other array to plot this array against another array.
6. Click Plot
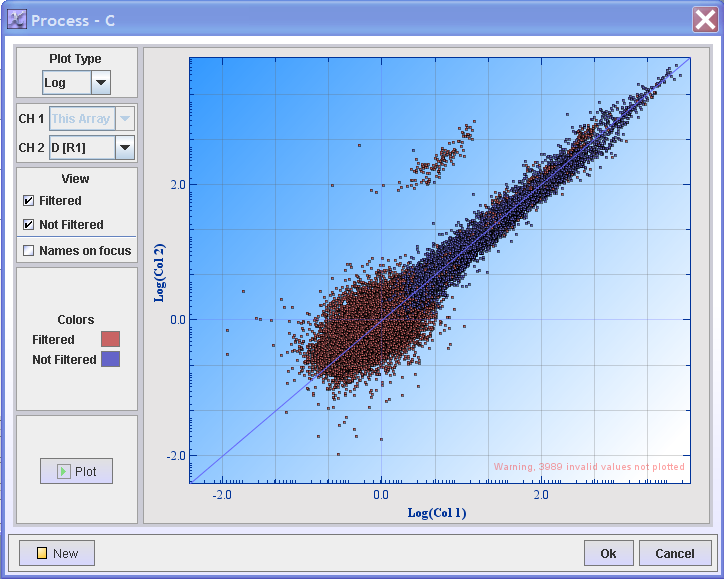
This plots all data before applying any filters or doing normalisation
7. If you only want to view the spots that have not been filtered, uncheck the Filtered checkbox and press Plot
8. When you are done, click OK
1. Click the ![]() button
button
2. Click the Other button.
3. Click the Plot button
4. In the plot type, select log
5. Click Plot
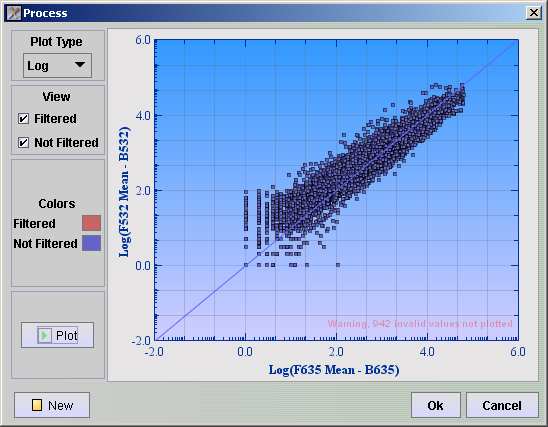
This plots all data before applying any filters or doing normalisation
6. If you only want to view the spots that have not been filtered, uncheck the Filtered checkbox and press Plot
7. When you are done, click OK
Spot Image view can only be applied to GenePix data.
1. Spot Image View is opened from the Process tab in SpotPix Suite. If you already have added Spot Image View to the process list, click Open in the Spot Image View row. If not click the ![]() button and then click the Others button. Here you will find the Spot Image View button. Click on it to open.
button and then click the Others button. Here you will find the Spot Image View button. Click on it to open.
We now want to see how different spots look across all arrays
2. Click on the View Mask checkbox
3. Click on the View Flags checkbox
4. Click on the View Filtered checkbox.
5. Click on the orange box next to View Filtered and set the color to dark red
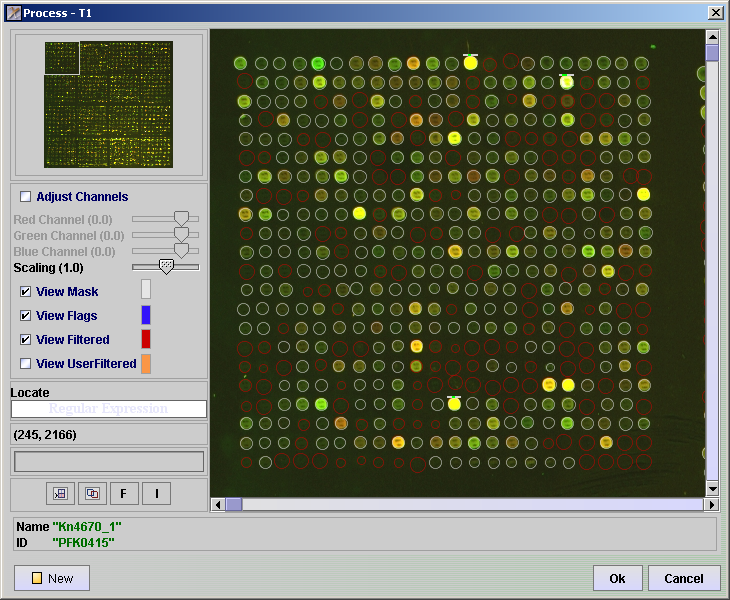
6. Click on the I button (Open Index List). The Image frame is modal, so the index list is located in the background of the image view. Move the image view window so that you can see the index selector window.
7. If you have some genes that you are interested in, you can locate these by searching in the Regular Expression text field. Hits will be marked with a blue square around them. Click on these spots. If you do not have any particular gene of interest, you can click on some spots that looks interesting to see what they look like on the other arrays.
8. Click OK
9. In the selection container there is a list of the spots you clicked on. Click the ![]() ( Get Spot Images ) NB! This may take some time
( Get Spot Images ) NB! This may take some time
This extracts the spots from all arrays
10. If you want to save this with your experiment, you can do so by clicking on the ![]() ( Store in Experiment ) button once. When you look back the data tab in the SpotPix Suite there will be an icon in the Objects field. There is one such save button in the SpotView and one in the Selection container.
( Store in Experiment ) button once. When you look back the data tab in the SpotPix Suite there will be an icon in the Objects field. There is one such save button in the SpotView and one in the Selection container.
11. Close the SpotView
12. Close the Selection Container
Flooring is used to keep spots that have high signal in one channel while the other channel have signal below some filtering threshold. See here for a discussion on using flooring.
1. Click the ![]() button
button
2. Click Filter button.
3. Click Value Filter
4. Filter elements with value < x
5. Click Ok.
6. Click Other
7. Choose Value Boundary
8. Set Fields with value < x to y
9. Click OK