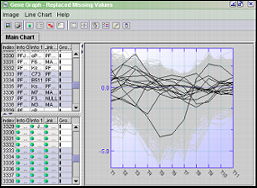

The Gene Graph Viewer ![]() provides
a detailed graphical and interactive view on a set of expression profiles. Several
profiles can be shown at one time in a Gene
Graph window allowing visual comparisons to be made between profiles. The
graphs can be exported as images or as HTML files, and additional information
on a particular profile can be obtained by searching external Internet databases
from within J-Express Pro. The Gene Graph window is often used to provide additional
information obtained from the other analysis methods available to you in J-Express
Pro.
provides
a detailed graphical and interactive view on a set of expression profiles. Several
profiles can be shown at one time in a Gene
Graph window allowing visual comparisons to be made between profiles. The
graphs can be exported as images or as HTML files, and additional information
on a particular profile can be obtained by searching external Internet databases
from within J-Express Pro. The Gene Graph window is often used to provide additional
information obtained from the other analysis methods available to you in J-Express
Pro.