The gene graph window provides many ways to control how the profiles are displayed. The following section will familiarize you with all visual functions of the Gene Graph.
When showing multiple profiles in the same Gene Graph window it may be difficult to separate one profile from another. Using the Shadow Unselected feature of J-Express Pro you can highlight profiles of your choice to bring out interesting features of a graph.
Saving a graph as an image:
To save a graph as a separate image file click the ![]() button
(Save chart) on the Gene Graph tool bar, or select Image | Save
from the Gene Graph menu bar. In the file location dialog that appears, locate
the folder where you want to save the image of the graph, enter a filename,
select the appropriate file extension, and click OK.
button
(Save chart) on the Gene Graph tool bar, or select Image | Save
from the Gene Graph menu bar. In the file location dialog that appears, locate
the folder where you want to save the image of the graph, enter a filename,
select the appropriate file extension, and click OK.
Printing a graph:
To print graphs simply press the ![]() button
(Print) on the Gene Graph toolbar, or select Image|Print from
the Gene Graph menu bar. Note: it is recommended to print graphs using
the Landscape paper orientation, since graphs usually are larger horizontally.
Consult your printer and/or operating system manual for information on how to
print using Landscape paper orientation.
button
(Print) on the Gene Graph toolbar, or select Image|Print from
the Gene Graph menu bar. Note: it is recommended to print graphs using
the Landscape paper orientation, since graphs usually are larger horizontally.
Consult your printer and/or operating system manual for information on how to
print using Landscape paper orientation.
How to use the Shadow Unselected feature:
1. From the list of profiles in the left part of the Gene Graph window select the profile you wish to highlight. To select multiple profiles lying next to each other in the list, select the first profile you want to highlight, scroll to the last profile you want to highlight, hold down the shift key and click the last profile. All profiles lying between the two will be selected. To select multiple profiles that lie separated in the list, hold down the control key on the keyboard while clicking on each profile to select them. You may also select genes in another window, e.g. a dendrogram window.
2. Click the ![]() button
(Shadow Unselected) or select Line Chart | Toggle Shadows from the Gene
Graph window menu bar. The selected profiles will be shown in full color, while
the other profiles will fade to a grey color.
button
(Shadow Unselected) or select Line Chart | Toggle Shadows from the Gene
Graph window menu bar. The selected profiles will be shown in full color, while
the other profiles will fade to a grey color.
Using the External Links List:
Click the ![]() button
(External Links List) on the Gene Graph tool bar. This splits
the selection window of the Gene Graph in two, with matching content. The top
window is used for selection as usual; the bottom window contains hyper-links
to the default external database on the World Wide Web. Click one of the rows
in this window to open a web browser and perform the external search.
button
(External Links List) on the Gene Graph tool bar. This splits
the selection window of the Gene Graph in two, with matching content. The top
window is used for selection as usual; the bottom window contains hyper-links
to the default external database on the World Wide Web. Click one of the rows
in this window to open a web browser and perform the external search.
Improving Graphical Quality:
Click the ![]() button
(Antialiasing) on the Gene Graph tool bar, or select Line Chart|Toggle
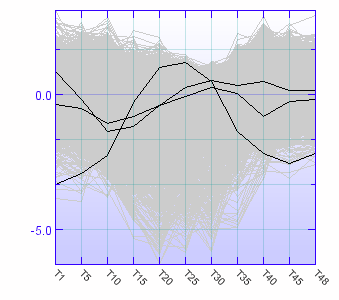
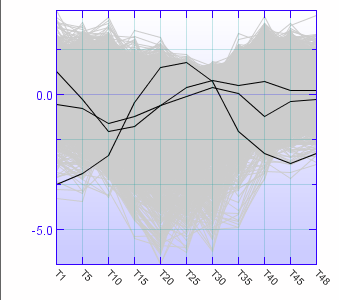
Antialias from the Gene Graph menu bar. The aliased (jagged) edges on the
graphs and text will disappear.
button
(Antialiasing) on the Gene Graph tool bar, or select Line Chart|Toggle
Antialias from the Gene Graph menu bar. The aliased (jagged) edges on the
graphs and text will disappear.
Note: on large datasets this function can be time-consuming. If you experience long pauses while refreshing or generating displays we suggest turning antialiasing off.


Antialiasing. The image on the left (top) shows a graph in normal mode, while the image on the right (bottom) shows the same graph in antialiased mode.
Creating a HTML version of a graph:
To create a HTML version of a graph
for display on a web page click the ![]() button
(Export to HTML) on the Gene Graph toolbar. In the file location dialog
that appears, locate the folder you want to save the HTML version of the graph,
enter a filename, and click OK. Make sure you give the file the
suffix .htm or .html
or you will be unable to open the file in your web browser.
button
(Export to HTML) on the Gene Graph toolbar. In the file location dialog
that appears, locate the folder you want to save the HTML version of the graph,
enter a filename, and click OK. Make sure you give the file the
suffix .htm or .html
or you will be unable to open the file in your web browser.
The HTML page generated contains the time/date the page was generated, an image of the graph, and a list of all profiles that that are shown in the graph. If Shadow Unselected is active then the selected profiles will be shown in bold typeface in the list.
Zooming a graph:
To zoom in on an area of interest in a graph, click the Zoom in
button ( ![]() ), and drag out the area you want to zoom in on. A new tab will be created in
the Gene graph window containing the zoomed view. To dispose of the zoom tabs,
click the Remove component button (
), and drag out the area you want to zoom in on. A new tab will be created in
the Gene graph window containing the zoomed view. To dispose of the zoom tabs,
click the Remove component button ( ![]() ).
).
Move ( ![]() ):
):
The move ( ![]() ) button enables you to grab the graph window using the mouse cursor instead
of using the scrollbars (if the graph is too big to fit in the window).
) button enables you to grab the graph window using the mouse cursor instead
of using the scrollbars (if the graph is too big to fit in the window).
Create Group (
![]() )
)
The Create Group ( ![]() ) button will create a group containing the selected genes that can be managed
further from the Group Controller(
) button will create a group containing the selected genes that can be managed
further from the Group Controller(
![]() ) on the J-Express Pro main tool bar.
) on the J-Express Pro main tool bar.
Repaint Component (
![]() ):
):
If changes you make do not take effect immediately, press
the Repaint Component ( ![]() ) button or select Line Chart |
) button or select Line Chart | ![]() Update and Repaint
Update and Repaint
Copy image to Clipboard ( ![]() );
);
To copy the image in any of the tabs to clipboard, click the
![]() button.
button.
Put in Tree ( ![]() ):
):
To place the entire component into the project tree select Line Chart| ![]() Put in Tree from the menu bar. This creates a new node in the project tree
that acts as a direct shortcut to the current component.
Put in Tree from the menu bar. This creates a new node in the project tree
that acts as a direct shortcut to the current component.
Color Mode
![]() Full color Mode - will display all component and group colors in the set color.
Full color Mode - will display all component and group colors in the set color.
![]() Black and White Mode - will display component and group colors in a shade of
grey.
Black and White Mode - will display component and group colors in a shade of
grey.
Speeding up Drawing ( ![]() )
)
By default drawing speedup is selected. This feature speeds up drawing by not painting profiles that will have small deviation from 0.0. The selection of the profiles that will not be painted is the following: If a gene does not have at least 1 value above 15% of the greates absolute value, it will not be painted. This is only when more than 1000 genes are visible at the same time. To turn off this feature and draw all profiles, press the button.
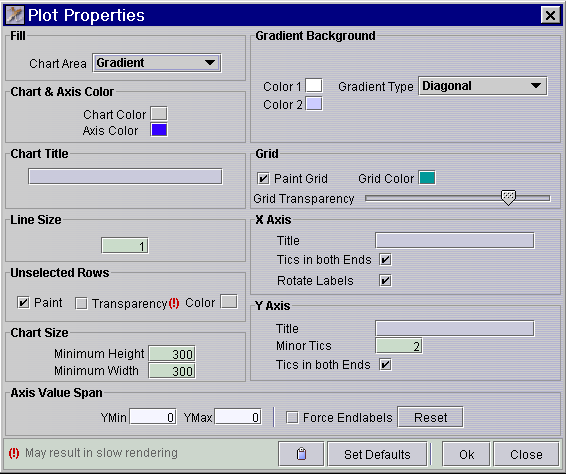
Right clicking on the graph or selecting Line Chart|Chart Layout will bring up the Plot Properties dialog. Here you can alter most visual aspects of the Gene Graph.

Plot Properties dialog.
The Fill menu allows you to choose the appearance of the background of the plot. The various options are:
One Color - Single color is used for the background. Click the colored square to the right of the menu to choose the desired color.
Gradient - Two colors are combined to create a smooth color gradient. Click the two colored boxes to choose the desired colors. Use the Gradient Type menu to select the type of gradient. Diagonal forms a color gradient from the upper left to the lower right corner, Top-Bottom forms a color gradient from the top of the plot to the bottom.
External Picture - Use the file selection dialog to select the image file you wish to use as a background for the plot. Selecting Stretch will stretch the image to fit the plot. Selecting Tile will repeat the image in a tile pattern if it is to small to cover the entire plot.
Tiles - Six additional patterns you can use for your plots.
The menu to the right of the Fill menu, is a menu that is linked to the options chosen in the Fill menu. If gradient is chosen the two colors can be selected in this menu. Likewise is External Picture is chosen, the picture path can be set in this menu.
Chart Title lets you create a title text for the plot that will be displayed at the very top of a plot .
Line Size sets the thickness of the line used for drawing the graphs, in pixels.
Unselected Rows lets you set options for the use of the Shadow Unselected feature.
Paint - uncheck this box to disable the display of the unselected profiles.
Transparency - uncheck this box to use a solid color for the unselected profiles. If checked, the color used to display unselected profiles will be partially transparent, showing part of the background color through. Note that the use of transparency may result in lower performance on slower systems.
Color - Click the color box to choose the color used for the unselected profiles.
Chart Size lets you set the minimum height and width of the plot, in pixels.
Axis Value Span - select the minimum and maximum value of the Y-axis that you are interested in looking at.
Force Endlabels - check to round the minimum and maximum values upwards (positive values) or downwards (negative values) to the closest value that can be divided by 5. The rounded minimum and maximum values will be forced to be at the bottom and top, respectively, of the diagram.
Reset button resets the minimum and maximum values to default.
Grid lets you set options for the plot grid.
Paint Grid - check this box to toggle display of the grid on. Uncheck it to toggle display of the grid off.
Grid Colors - select the desired color for the grid by clicking on this box and choosing a color from the dialog that appears.
Grid Transparency - Use this slider to set the transparency of the grid, relative to the background.
X Axis lets you set options for the appearance of the x-axis of the plot
Title - lets you set a title for the x-axis, which will be shown at the bottom of the plot.
Tics in both Ends - check this box to have unit tics at both the top and bottom of the plot. If left unchecked, unit tics will only be used along the bottom of the plot.
Rotate Labels - Check this box to rotate the text for the state labels by 45 degrees.
Y Axis lets you set options for the appearance of the y-axis of the plot.
Title - lets you set a title for the y-axis, which will be shown on the left side of the plot.
Minor tics - enter the number of minor tics you want between every major tic along the y-axis in this box.
Tics in both ends - check this box to have unit tics at both the left and right side of the plot. If left unchecked, unit tics will only be used on the left side of the plot.