Fold change Viewer / Between sample (group) fold
change
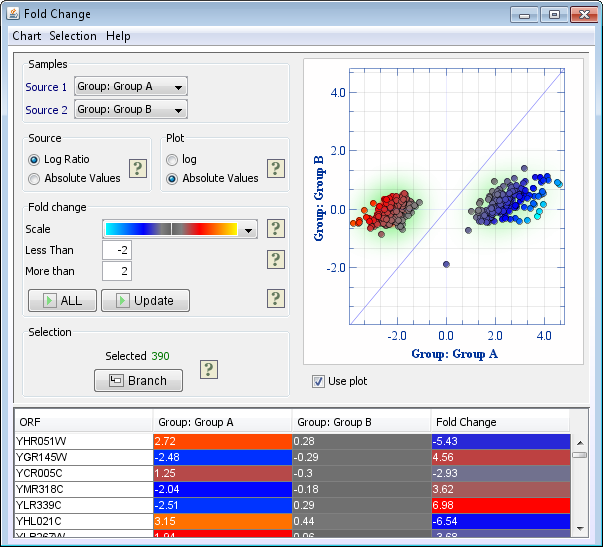
The change between two samples or between the means of groups of samples, can be described by fold change. It states how much larger the value of one sample is with respect to another, or one group mean with respect to another. This can be used to find genes that are differentially expressed.
- Open
 ( Between Sample Fold Change ) from the J-Express tool bar, or select Methods | Charts | Fold Change Viewer from the J-Express menu bar.
- Select the two samples or groups you want to compare by selecting them in the combo boxes at Source 1 and Source 2. Defined groups will be listed below all the samples.
- Leave the default selections for Source Data Format and Plot Type. J-Express will automatically detect which data format you have and select the best plot type.
- Click the ALL button to plot all the genes of the two samples against each other.
- Click
 Update button to only plot the genes that have a fold change above or below the given limits. +-2 fold change is set as default, but you can change these limits. The plotted genes will be selected in the bottom table.
- Use the Scale combo-box to choose a different colour scheme.
- To create a sub-data set containing only the selected genes, click the
 Branch button.

