Rank Product
Rank Product (Breitlin et al), is relatively intuitive method that can be used to find differentially expressed genes as well as being used as a meta analysis method. It does not use any statistics, but rather scores genes on the bases of their ranks in multiple comparisons. The method is useful if you have very few replicates, or if you want to analyse how well the results from two studies agree.
Run Rank Product
- To perform Rank Product analysis, you need to define groups of samples within your dataset.
- Start Rank Product analysis by clicking on Methods | Supervised Analysis | Rank Product
- Select the groups or pairs to be compared (If you have two colour arrays it is possible to only select one group) and click Next
- Select the number of permutations to be performed for the analysis. If you want to do 400 permutations, this means that the number of permutations performed will be 400 * the number of comparisons, so be patient when using Rank Product.
- Click Run to start the analysis
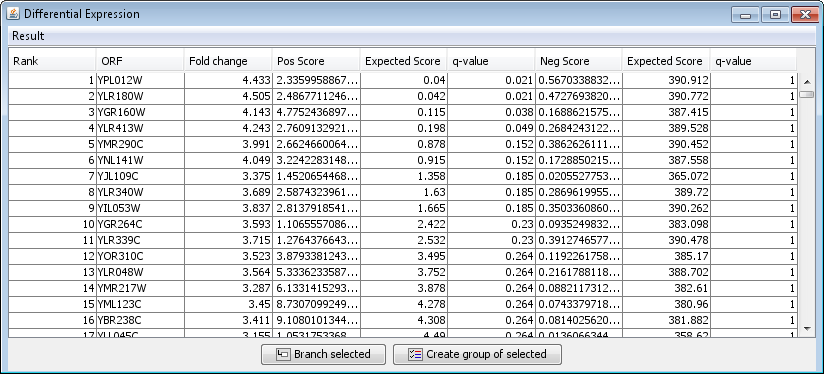
The rank product is calculated twice. The reason is that the results may be different depending on whether the ranks are based on fold change from Group 1/Group 2 or Group 2/Group 1. The results from the two analysis are listed in the column Pos Score and Neg Score, each with their respective Expected scores and q-values.
Outputting results
There are different ways of outputting the result from the analysis:
- Save the analysis in the project tree (this is very useful as it allows you to view the results again at a later time point, without having to repeat the analysis)
- Select Store in project from the Result menu
- Create groups or create subdatasets with the best scoring genes
- Click on the header of the Pos Score column to sort the results according to the first analysis, and the Neg Score column to sort the result according to the other analysis.
- The good scores are very small, and to see the entire number you may need to resize the score columns. Sort the genes so that the smallest scores are towards the top of the table and select the genes at the top. Note: this must be done separately for the Pos Score and Neg Score
- Click the Create group of selected button to give these genes a specific colour.
- Click the Branch selected button to branch the selected genes to a separate subdataset in the project tree.