Significance analysis of microarrays (SAM)
SAM is a method that can be used to identify differentially expressed genes. Each gene is assigned a score on the basis of its change in gene expression relative to the standard deviation of repeated measurements. The genes that have a score which is significantly higher than the expected score are termed differentially expressed. The expected score is calculated by permuting the measurements, and then taking the average score for all the permuted scores as the expected score. The percentage of genes falsely identified as differentially expressed is called False Discovery Rate (FDR). For more details on SAM, see
Tusher VG, Tibshirani R, Chu G. Significance analysis of microarrays applied to the ionizing radiation response. PNAS. 2001 Apr 24;98(9):5116-21
Running SAM
- To perform SAM analysis, you need to define groups of samples within your dataset.
- The SAM analysis can be started from the Methods | Supervised analysis menu or by clicking the
 (Significance Analysis of Microarrays) button. In the window that opens, select the two groups to be compared by checking the boxes in the Selection column and click the Next button.
- In the next window you can set the maximum number of permutations to be performed in order to calculate the expected scores and FDR. One way of assessing whether you have done enough permutations is to do the analysis again and compare the FDR values. If they are not consistent, more permutations may be needed.
- In addition you need to tell J-Express whether your data values are Linear (non-logged), Log2 or some other transformed values. Click Next to perform the analysis
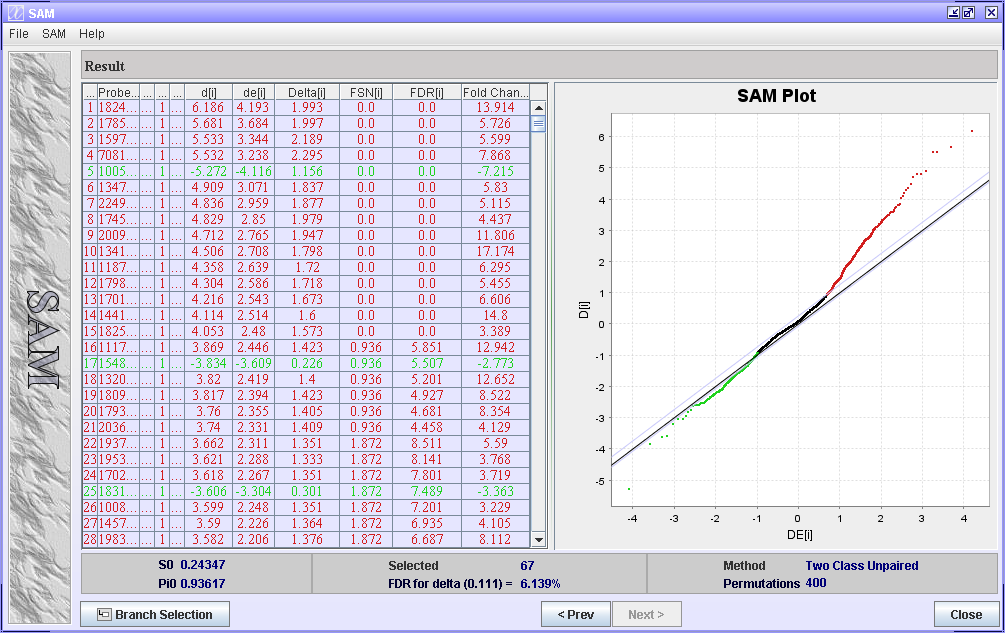
In the Result window, you are presented with a table containing the genes of your dataset sorted accordig to their score in an ascending order. The score used by SAM is called d-score.
Interpreting the result
The result table
- Called - is the rank of gene[i].
- d[i] - the d-score for a particular gene. (The d-score is similar to t-score for the t-test, when comparing two samples.)
- de[i] - the expected relative difference. A d-score is also calculated for every gene for every permutation (dp[i]). de[i] is defined as the average dp[i] over all permutations.
- FSN[i] - the False Significant Number is the number of Called significant genes that are expected to be false.
- FDR[i] - 100 * FSN[i] / Called.
- Delta[i] - the distance from the black line in the plot where D[i]=DE[i].
- Fold Change - is calculated for each gene by first finding the average value for each group, and then doing anti-log of the difference between the groups, i.e. 2^(average group A - average group B).
- Note: Some SAM implementations find the fold change by first doing the anti-log of all values for the gene, i.e. 2^(value). Next the average is calculated for each group, and finally the fold change is found by calculating the ratio between the average group values. If comparing the fold change values obtained from the two methods, they may not always agree. Fold change calculation is quite sensitive to outliers, and this may cause differences in fold between antilog before and antilog after the calculation of the mean.
- q-val[i] - is the lowest FDR of all gene lists (starting at the top) for which gene(i) is included.
The SAM Plot
In the SAM Plot the observed difference D(i) is plotted against the expected diference DE(i). The black line indicates the line for D(i) = DE(i). The two grey lines on either side of the black line, are drawn at delta distance from the black line. The grey lines show the selected thresholds. Spots further away from the black line than the grey lines are considered differentially expressed.
Selecting genes
Click on different genes to see how the grey lines move. The genes outside the grey lines will be considered differentially expressed. When selecting the threshold of the gene list choose a q-value you think is ok. To select the genes for your gene list select the first gene of the list (Called # 1), then scroll to the last Called number you want in your gene list (with an ok q-value), press Shift - and click this gene.
Outputting results
There are severalt ways of outputting the result from SAM:
- Save the analysis in the project tree
- Choose Put in project tree from the SAM menu. A new node will be added to the J-Express project tree. You can double-click, or right-click on that node to reopen this analysis window.
- You can save the entire table to a text file
- Save and print the plot
- Click Save Chart or Print Chart from the File menu
- Branch selection to continue working with the selected genes in J-Express.
- Click the
 Branch Selection button. The new branch will be added to the J-Express project tree under the dataset you are working on. It will look like this:
  SAM.
SAM.