Gene ontology
analysis
Gene ontologies are controlled vocabularies used to describe genes. Read more abou gene ontologies at
www.geneontology.org
Files needed for the analysis
- OBO file - this file comes with the J-Express installation, but ideally it should be updated regularly.
- Get an updated version from http://www.geneontology.org/GO.downloads.ontology.shtml.
- OBO v1.0 is recommended for use with J-Express. Right-click on the OBO v1.0 link and select "Save Target As".
- Save the file to <J-Express home directory>\resources\go\ folder.
- Mapping File - this file can be downloaded from http://www.geneontology.org/GO.current.annotations.shtml. The mapping file must be placed in the correct folder which is <J-Express home directory>\resources\go\goassociations. Unzip it before you use it.
Analysis
Before doing any analysis the GO terms must be linked to the dataset.
- Follow the steps under Mapping to see how this is done.
There are two types of analysis you can do:
- Browse gene ontologies that map to the dataset
- Find gene ontologies that are overrepresented in the dataset
Outputting results
Press F1 for more help on this component.
Mapping
- Click the
 ( Gene Ontology Mapping ) button or select from the methods menu.
- In the Mapping File combo box, select the correct mapping file.
- J-Express can use one of two columns from the mapping file. If Use Synonyms is selected column 11 will be used, and if it is not selected column 3 will be used. Open the mapping file in Excel to see what type of ids it has in column 3 and 11, or see the README file for your organism. When you close the file again, do not save changes if you get this question. Excel sometimes does strange things to files.
- In the Data Identifier Column combo box, select the column from your J-Express data set containing the same gene identifiers that is used in column 3 or 11 in the mapping file. If none of these identifiers are not present in your J-Express dataset, use the Annotation Manager to add it.
- Click
 Map Data set
Browsing
- It is often a good idea to have a Gene Graph open when browsing GO terms, so that you can see the gene profiles of the gene terms you select. Click the
 ( Gene Graph ) button or selecting Methods | Charts | Gene Graph Viewer from the J-Express menu bar.
- Move the GO TREE window and the Gene Graph window so that you can see both at the same time.
- In the Gene Graph window: click the
 ( Shadow Unselected ) button. All gene profiles should now become faint. When making selections in other components you can see the expression profiles of the selected genes in this window.
- In the GO TREE window: open the different Gene Ontology terms (by double clicking or clicking the open handle) and browse the trees. See how the gene graph profiles change as you select a node (if the number of genes in the object are more than 1 and less than the Maximum Members, default 100).
- Is there any co-regulation associated with the Gene Ontology Term?
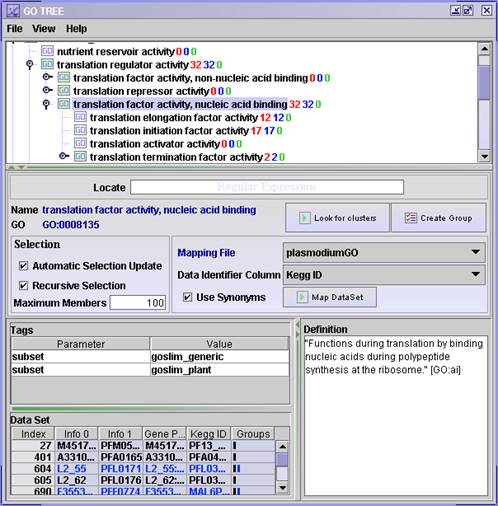
- The red numbers in the tree shows how many genes are annotated to this particular GO term.
- The blue number shows the total number of genes annotated to this GO term and down-wards in the tree to its children.
- The green number shows the difference between the blue and the red number, hence this is the number of genes annotated to this nodes children.
Overrepresentation Analysis
After having found some interesting genes, e.g. from differential expression analysis, GO overrepresentation analysis can be used to see if particular GO terms are enriched in the gene list. To decide whether there is an overrepresentation of some GO terms, the number of genes in the gene list linked to particular terms must be compared with the expected number of genes linked to that term. This can be calculated from a reference dataset. Follow the steps below to see how you can do this in J-Express.
- Select the dataset you want to use as reference dataset. This will typically be the dataset you used for differential expression analysis. It should contain all eg. all of the genes on the array or all genes that are considered to be expressed in the system you are looking at.
- Open the GO component and follow the steps described under the Mapping section
- Select the dataset containing only the gene list of interesting genes that you want to check for overrepresentation
- Open another GO component and follow the steps described under the Mapping section
- In the GO component for the gene list, select Statistical comparison to other GO components from the View menu.
- A pop-up window will tell you that it found the GO component for the reference dataset. Click Ok.
- A new window will appear containing a list of sorted GO terms, with the most enriched terms at the top of the list. Select a GO term from the top of the list. This term will then be highlighted in the GO tree windows where you can see where it belongs in the hierarchy, and if you have a Gene Graph open, you can see the gene profiles of the genes liked to this GO term.
Outputting results
The File and View menues contain different ways of output results form the GO component.